Kyle Roman Real Estate -
MBA International Business, REALTOR®, Property Management
778.847.3325 Kyle@KyleRoman.com
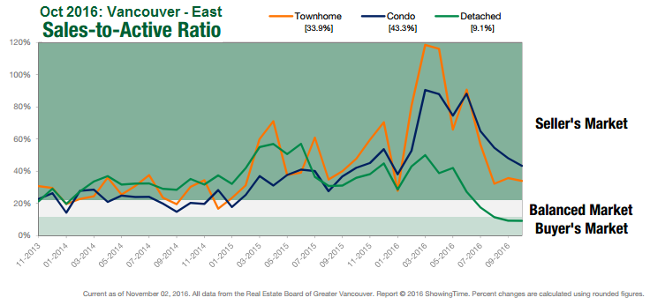
March 2017 February 2017 Vancouver Market Update: Detached house sales at balanced or Seller's market (depending on area) while condo sales remain strong. Multiple offers situations are common.
Detached house sales for Westside and East Vancouver have shown improvement and are now comfortably in the balanced market zone (17% and 13% monthly turnover respectively), while North Vancouver house sales saw a 40% turnover ratio (Seller's market) in February, with multiple offers the norm in listings under ~$1.5M. Higher priced home sales remain somewhat slower.
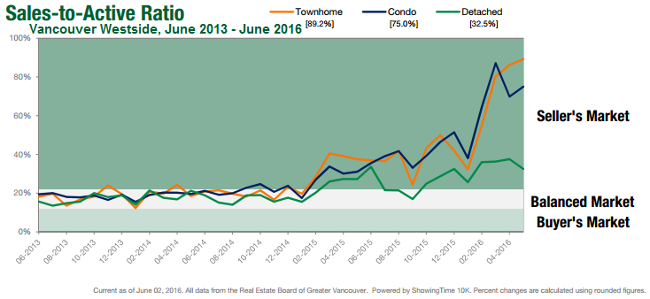
Condo sales remain strong, with a February turnover (sales-to-active ratio) ranging from 35% (West Van) to 84% (North Van). Again, multiple-offer situations are once again very common. (NOTE: A sustained sales-to-active ratio of <12% tends to put downward pressure on prices, while a sustained >~21% ratio tends to put upward pressure on prices).
Prices: Demand, especially in condos (also detached houses in North Vancouer), is putting upward pressure on prices.
Below: East Vancouver Sales-to-Active graph & 10-year Price Trend
Contact Kyle (click here) for more info or stats on other Greater Vancouver areas.
#Vancouverrealestate #marketupdate #vancouverhomes #vancouvercondos #BuyVancouverNow

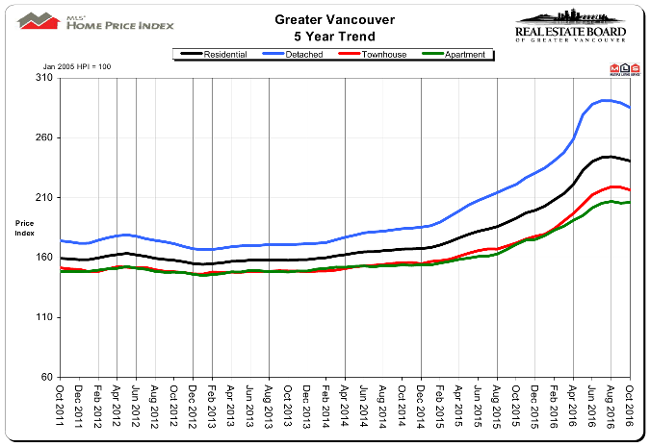
December 2016 November 2016 Vancouver Market Update: Metro Vancouver sales remain near historic averages.
Residential sales were down 0.6% from October 2016 but down 37.2% from November 2015 (one of the busiest Novembers on record). According to the Real Estate Board of Greater Vancouver (REBGV) the sales-to-active ratio for November 2016 was 26.4% (up 2% from October's 24.4 per cent) indicating a Seller's market (NOTE: A sustained sales-to-active ratio of <12% tends to put downward pressure on prices, while a sustained >~21% ratio tends to put upward pressure on prices).
Prices: Compared to last month (Oct 2016), prices have remained stable for apartments and attached properties and are down slightly (2.2%) for detached houses.
Below: Greater Vancouver 5-year Price Trend
Contact Kyle (click here) for more info or stats on other Greater Vancouver areas.
#Vancouverrealestate #marketupdate #vancouverhomes #vancouvercondos #BuyVancouverNow
November 2016 October 2016 Vancouver Market Update: A slowing of the market in some areas - but really depending on the area & product segment. An overall robust market continues.
According to the Real Estate Board of Greater Vancouver (REBGV) the sales-to-active ratio for October 2016 was 24.4 per cent, indicating a Seller's market (NOTE: A sustained sales-to-active ratio of <12% tends to put downward pressure on prices, while a sustained >~21% ratio tends to put upward pressure on prices).
Prices are up ~25% from last October and down slightly (~1%) from last month (Sept 2016).
Below: Vancouver Westside and East Vancouver 3 year Sales-to-Activity Ratios (Sales numbers compared to all listings).
Contact Kyle (click here) for more info or stats on other Greater Vancouver areas)
#Vancouverrealestate #marketupdate #vancouverhomes #vancouvercondos #BuyVancouverNow

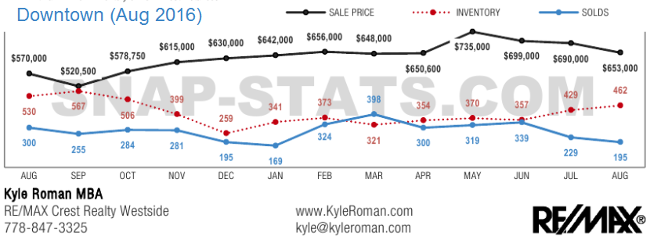
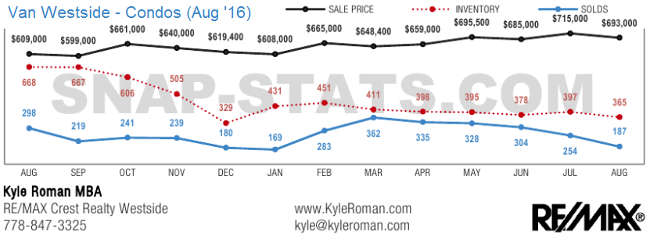
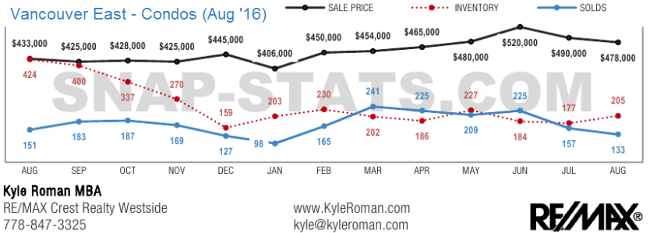
September 2016 August 2016 Vancouver Market Update: A mixed bag - some market segments return to more normal numbers while others remain significantly busier than historic averages
According to the Real Estate Board of Greater Vancouver (REBGV) the sales-to-active ratio for August 2016 was 29.3 per cent, indicating a Seller's market (NOTE: A sustained sales-to-active ratio of <12% tends to put downward pressure on prices, while a sustained >~21% ratio tends to put upward pressure on prices).
As seen below, detached houses have experienced the largest slow down in sale numbers in Vancouver while condo sales remain busy.
Below: Vancouver Westside and East Vancouver 13 month Listing/Sales/Average sales price graphs. Contact Kyle (click here) for more info or stats on other Greater Vancouver areas)
#Vancouverrealestate #marketupdate #vancouverhomes #vancouvercondos #BuyVancouverNow


Summer 2016 Contact Kyle for complete Market Stats for Summer 2016
June 2016 May 2016 Vancouver Market Update: Unprecedented demand for homes continues
Residential sales were up 17.6% over May 2015 to 4,769 for the month. This is 35.3% above the 10 yr average for the month.
Benchmark price for Metro Vancouver homes is up 29.7% compared to May 2015.
Below: Vancouver Westside and East Vancouver 3 year Sales-to-Activity Ratios (Sales numbers compared to all listings). Contact Kyle (click here) for more info or stats on specific Greater Vancouver areas) #Vancouverrealestate #marketupdate #vancouverhomes #BuyVancouverNow

May 2016 April 2016 Vancouver Market Update: Highest selling April on record for Metro Vancouver
Unprecedented demand for homes continues: Residential sales were up 14.4% over April 2015 to 4,781 for the month. This is 41.7% above the 10 yr average for the month.
Benchmark price for Metro Vancouver homes is up 25.3% compared to April 2015.
Below: Vancouver Westside and East Vancouver 3 year Sales-to-Activity Ratios (Sales numbers compared to all listings). Contact Kyle (click here) for more info or stats on specific Greater Vancouver areas) #Vancouverrealestate #marketupdate #vancouverhomes #BuyVancouverNow


April 2016 March 2016 Vancouver Market Update: Highest March sales ever for Metro Vancouver
Sales were once again 56% above the 10yr average. Listings are 40% lower than 1 year ago.
Condo Stats: 100% of listings sold (Downtown), 88% sold on Westside, 100% sold in East Vancouver.
The MLS® Home Price Index composite benchmark price for all residential properties in Metro Vancouver is up 23.2 per cent compared to March 2015.
Below: Greater Vancouver 5 Year Pricing Trends (contact Kyle (click here) for more info or stats on specific Greater Vancouver areas) #Vancouverrealestate #marketupdate #vancouverhomes #BuyVancouverNow
-650-wide.jpg)
March 2016 February 2016 Vancouver Market Update: Red hot market continues
February set a record for total home sales in Greater Vancouver. Sales were 56% above the 10yr average.
Condo stats: 9 out of 10 listings sold (Downtown); 6 out of 10 sold (Vancouver Westside); 7 out of 10 sold (Vancouver Eastside)
Below: Vancouver Westside Market Graphs
(contact Kyle (click here) for more info or stats on other Greater Vancouver areas):
-650-wide.jpg)
Feb 2016 January Vancouver Market Update: Red hot Seller's market
Downtown (condos): 50% of all listings sold; Average days-on-market (DOM): 9; Average sales price: at list price;
Westside Attached (condos):39% of listings sold; Average DOM: 16 days; Average sales price: 1% above list price.
Westside Detached (houses): 29% of listings sold; Average DOM: 15 days; Average sales price: up 9% from previous month (Dec)
Eastside Attached (condos): 48% of listings sold; Average DOM: 16 days; Average sales price: within 1% of list price.
Eastside Detached (houses): 35% of listings sold: Average DOM: 12 days; Average sales price: 3% above list price.
Below: Vancouver Downtown Attached (condo), Westside Attached (condo), and Westside Detached (houses) stats (contact Kyle (click here) for stats on other Greater Vancouver areas):


Dec 02, 2015 November Vancouver Market Update
November sales were the second highest on record while listing dropped substantially. Sales up 40% over Nov 2014 and 46% above the 10 year average for the month. Listings are down 35% from Nov 2014. The market is tightening and prices are continuing to increase.
For more details see the 5 yr price trends graph below. Full Board stats click here: Nov 2015 REBGV Stats. Contact Kyle here for stats on specific Greater Vancouver areas.
#Vancouverrealestate #marketupdate #vancouverhomes

Nov 06, 2015 Vancouver Westside Market Graphs
Summary of pricing & activity trends on Vancouver's Westside. Contact Kyle (click here) for stats on other Greater Vancouver areas.

Nov 03, 2015 Greater Vancouver October Stats Summary
Vancouver's strong market continues. October's sales were 19% higher than Oct 2014 sales and 36% above the 10 yr average for the month. Source: REBGV Stats (Nov 03, 2015)

October 23, 2015 Post Election Market Analysis
A short analysis by BMO Capital Markets on the market's response to Canada's recent election and their take on what effect the Liberal's proposed strategies will have going forward. (Source: BMO Capital Markets "Focus" - Oct 23, 2015)


October 09, 2015 September Vancouver Market Update
Summary: Market continues to be busy. Downtown: 45% of listings sold; Westside Attached (condos):1 of every 3 listings sold; Eastside Attached (condos): 46% of listings sold; Eastside Houses: 37% of listings sold. Some seasonal slowdown in Westside Detached House sales: 20% of listings sold.
Sample: Vancouver Westside Attached (condo) stats (contact Kyle (click here) for stats on other Greater Vancouver areas):

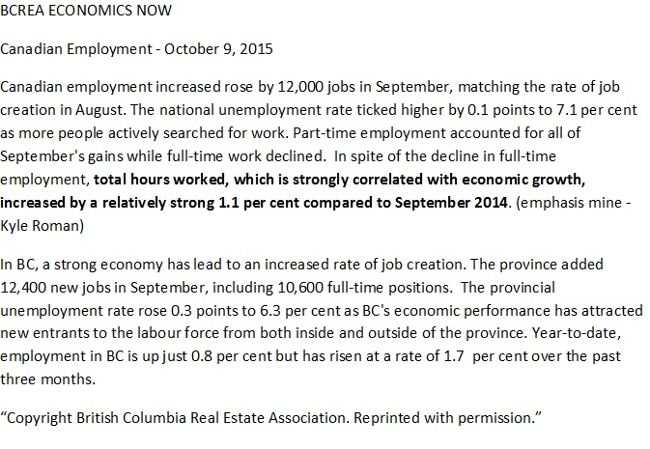
October 09, 2015 Canadian and BC Employment Up in September
Summary: Canadian employment up 12,000 jobs (matching August's job creation #s). Total hours worked (correlated to econ growth) up 1.1%. 12,400 jobs created in BC, incl 10,600 full-time positions.
Details:
May 2015 Metro Vancouver market continues to be red hot - May residential sales up 23% from a year ago.
Greater Vancouver Market Update: click here
Downtown Vancouver Market Snapshot:
Continued strong sales with 38% of listings selling last month. Huge demand and multiple offers for Downtown listings: 50%+ of homes priced $300-$600k sold in May.
Contact Kyle (kyle@kyleroman.com) for stats on other Greater Vancouver areas.

Jan 2015 Vancouver market continues to buzz - Jan sales 14.9% above the 10-year sales average for the month.
Greater Vancouver Market Update: click here
East Vancouver Detached (house) Market Snapshot:
Low inventory. Strong sales. 38% of listings sold in January.
Contact Kyle (kyle@kyleroman.com) for full Greater Vancouver area statistics.

Nov 2014 Greater Vancouver Market Update: click here
For a quick overview of the past couple of years and future outlook, have a look at this 2 min video: video update
Downtown Vancouver Attached (Condo) Market Snapshot: Downtown/Yaletown/West End
Contact Kyle (kyle@kyleroman.com) for detailed information on other areas or past dates.

Oct 2014 Greater Vancouver Market Update: click here
Sept 2014 Greater Vancouver Market Update: click here
Aug 2014 Greater Vancouver Market Update: click here
July 2014 Greater Vancouver Market Update: click here
June 2014 Greater Vancouver Market Update: click here
May 2014 Greater Vancouver Market Update: click here
April 2014 Greater Vancouver Market Update: click here
March 2014 Greater Vancouver Market Update: click here
Feb 2014 Greater Vancouver Market Update: click here
Jan 2014 Greater Vancouver Market Update: click here

Looking for more detailed sales & listing statistics for your area?
Email or phone Kyle - kyle@kyleroman.com (778.847.3325).
Kyle RomanMBA, REALTOR® |

Site Design is a copyright myRealPage.com Inc. All rights reserved.
Check myRealPage.com Mail - Access Private Office